


🎯 検証の目的
性能監視ツールの効果を実際に確認するため、Spring Petclinicアプリケーションに意図的な遅延機能を実装し、New Relic APMでどこまで詳細に監視・分析できるかを検証しました。
検証のポイント
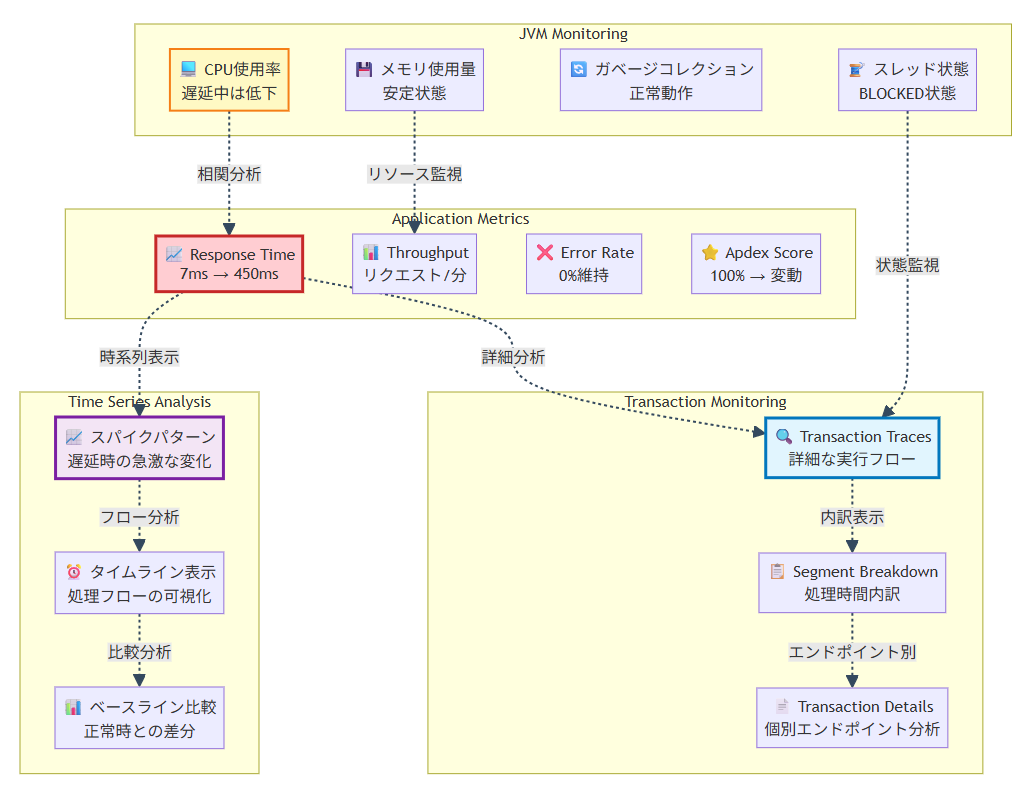
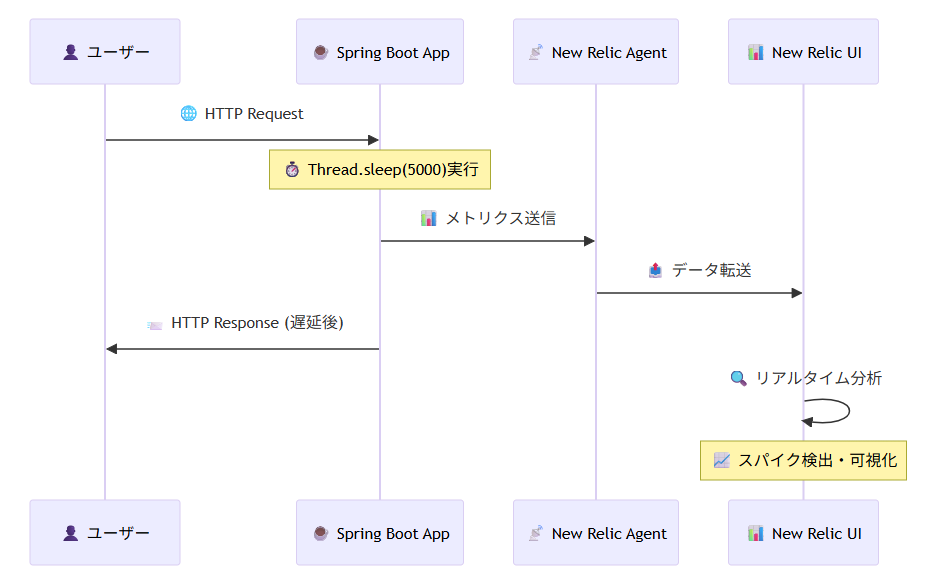
🎯 要点: Thread.sleep()による遅延が、Application Codeセグメントで正確に計測され、 リアルタイムでスパイクパターンとして可視化されます。
Thread.sleep()による人工的な遅延がNew Relicで検出できるか- エンドポイント別の性能変化をリアルタイムで追跡できるか
- 性能劣化から正常化までのプロセスを可視化できるか

全体アーキテクチャ
Spring Boot アプリケーション、New Relic Agent、外部サービス間の関係を示しています。
遅延機能がどこに実装され、どのように監視されるかが一目で分かります。
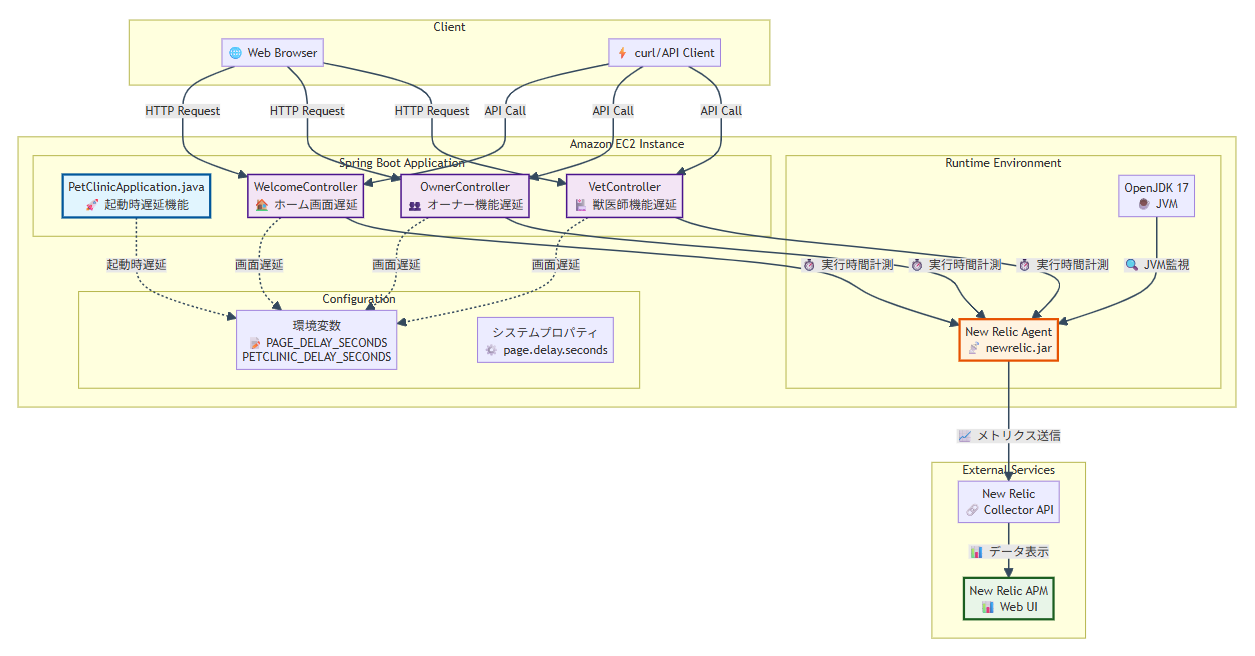

🛠️ 技術スタック
- アプリケーション: Spring Boot Petclinic v3.5.0
- 遅延実装:
Thread.sleep()メソッド - 監視ツール: New Relic APM
- 実行環境: Linux (Amazon EC2)
- Java: OpenJDK 17
📋 実装アプローチ
遅延機能の実装構成
1. 起動時遅延の実装

PetClinicApplication.java に起動時遅延機能を追加:
@SpringBootApplication
public class PetClinicApplication {
public static void main(String[] args) {
// 遅延時間を取得(複数方法対応)
int delaySeconds = getDelaySeconds(args);
if (delaySeconds > 0) {
executeStartupDelay(delaySeconds);
}
SpringApplication.run(PetClinicApplication.class, args);
}
private static void executeStartupDelay(int seconds) {
System.out.println("🕐 Starting application with " + seconds + " seconds delay...");
try {
// プログレスバー付きカウントダウン
for (int i = seconds; i > 0; i--) {
System.out.print("⏳ Remaining: " + i + "s ");
System.out.println("█".repeat(Math.max(0, seconds - i + 1)));
Thread.sleep(1000);
}
System.out.println("✅ Delay completed. Starting application...");
} catch (InterruptedException e) {
Thread.currentThread().interrupt();
System.err.println("❌ Startup delay interrupted: " + e.getMessage());
}
}
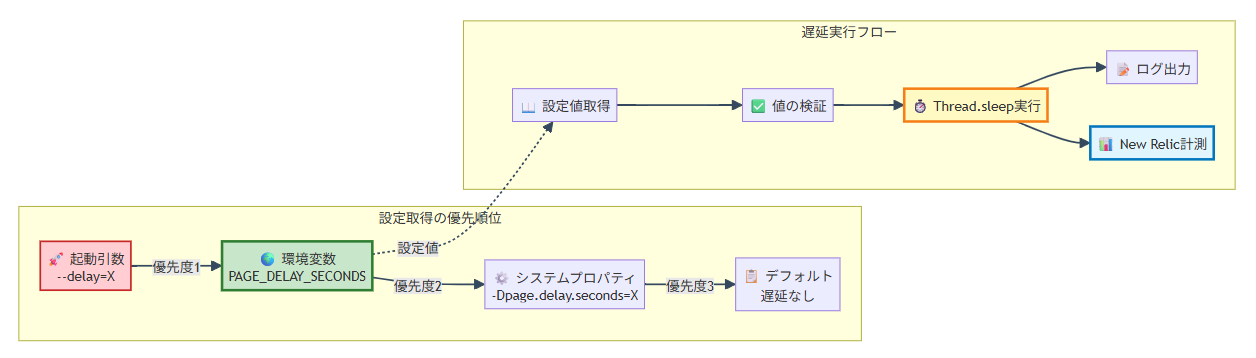
}設定方法(優先順位順)
- 起動引数:
--delay=5 - 環境変数:
PETCLINIC_DELAY_SECONDS=5 - システムプロパティ:
-Dpetclinic.delay.seconds=5
2. 画面遷移遅延の実装
各コントローラーに共通の遅延処理を追加:
ホーム画面(WelcomeController.java)
@Controller
class WelcomeController {

    @GetMapping("/")
    public String welcome() {
        executePageDelay("HOME", getDelaySeconds());
        return "welcome";
    }

    private void executePageDelay(String pageName, int seconds) {
        if (seconds > 0) {
            long startTime = System.currentTimeMillis();
            try {
                Thread.sleep(seconds * 1000L);
                long executionTime = System.currentTimeMillis() - startTime;
                System.out.printf("🐌 Page delay executed: %s - %d seconds (actual: %dms)%n",
                                pageName, seconds, executionTime);
            } catch (InterruptedException e) {
                Thread.currentThread().interrupt();
                System.err.printf("❌ Page delay interrupted: %s - %s%n",
                                pageName, e.getMessage());
            }
        }
    }
}
オーナー検索画面(OwnerController.java)
@GetMapping("/owners/find")
public String initFindForm() {
    executePageDelay("FIND_OWNERS", getDelaySeconds());
    return "owners/findOwners";
}

@GetMapping("/owners")
public String processFindForm(@RequestParam(defaultValue = "1") int page,
                             Owner owner, BindingResult result, Model model) {
    executePageDelay("OWNERS_SEARCH", getDelaySeconds());
    // 既存の検索処理...
}
獣医師一覧画面(VetController.java)
@GetMapping("/vets")
public String showVetList(@RequestParam(defaultValue = "1") int page, Model model) {
    executePageDelay("VETERINARIANS", getDelaySeconds());
    // 既存の処理...
}
3. 設定の柔軟性
遅延時間は環境変数で制御可能:
# 画面遷移に5秒遅延を追加
export PAGE_DELAY_SECONDS=5

# 起動時に10秒遅延を追加
export PETCLINIC_DELAY_SECONDS=10
🚀 実行とテスト
ビルドと起動
# コーディング規約適用
./mvnw spring-javaformat:apply

# コンパイル確認
./mvnw compile

# JARファイル作成
./mvnw clean package -DskipTests

# New Relicエージェントと一緒に起動
PAGE_DELAY_SECONDS=5 java -javaagent:/opt/newrelic/newrelic.jar \
    -jar target/spring-petclinic-3.5.0-SNAPSHOT.jar \
    --server.port=8081
動作確認
# 各エンドポイントのテスト
curl -w "@curl-format.txt" http://localhost:8081/
curl -w "@curl-format.txt" http://localhost:8081/owners/find
curl -w "@curl-format.txt" http://localhost:8081/vets
curl -w "@curl-format.txt" http://localhost:8081/owners
📊 New Relic監視結果
ベースライン性能(遅延なし)
- 平均応答時間: 7-9ms
- エラー率: 0%
- Apdex Score: 100%
- Transaction分布: 均一な処理時間
遅延適用時の劇的変化
- 平均応答時間: 200-450ms(50倍増加)
- 最大応答時間: 981.63ms
- Transaction分布の変化:
vets.html (GET): 54.85%(最大処理時間)owners/find (GET): 4.35%(GET) /: 25.73%

詳細監視結果
Transaction Tracesで確認された内容:
Thread.sleep()による遅延がApplication Codeセグメントで正確に計測- エンドポイント別の処理時間内訳が詳細に記録
- スパイクパターンが時系列グラフで明確に可視化
JVM Metricsでの観察:
- CPU使用率: 遅延中は低下(待機状態のため)
- メモリ使用量: 安定した状態を維持
- ガベージコレクション: 正常動作
🎯 重要な発見
1. New Relicの検出精度
Thread.sleep()による人工的な遅延も、New Relicでミリ秒単位で正確に検出・記録されました。
2. リアルタイム監視の威力
遅延を適用した瞬間から、グラフに明確なスパイクが表示され、性能劣化を即座に視覚化できました。
3. エンドポイント別分析
各画面(ホーム、オーナー検索、獣医師一覧)の遅延が個別に追跡され、どの機能に問題があるかを特定可能でした。
4. 正常化プロセスの可視化
遅延設定を削除してアプリケーションを再起動すると:
- 応答時間: 450ms → 6.19ms
- Transaction分布: 正常パターンに復帰
- CPU使用率: 効率的レベルに改善
💡 実際の運用への応用
性能問題の調査手法
今回の検証で確立できた調査アプローチ:
- ベースライン確立: 正常時の性能指標を記録
- 変化点特定: スパイクやパターン変化の時刻を特定
- エンドポイント分析: Transaction別の詳細調査
- 原因特定: Segment breakdownでボトルネック箇所を特定
監視アラートの設定指針
- Response Time: 平常時の3倍を超えた場合
- Error Rate: 1%を超えた場合
- Apdex Score: 0.7を下回った場合
🔧 実装時の注意点
Thread.sleep()の使用について
本検証では意図的にThread.sleep()を使用しましたが、本番環境では以下の点に注意:
- リソース消費: スレッドブロッキングによるスループット低下
- 割り込み処理:
InterruptedExceptionの適切なハンドリング - タイムアウト: 意図しない長時間待機の防止
監視設定の最適化
- サンプリング率: 高トラフィック環境でのパフォーマンス考慮
- データ保持期間: コスト効率的な設定
- アラート閾値: 誤検知を避ける適切な設定
📈 検証結果まとめ
| 項目 | 通常時 | 遅延適用時 | 正常化後 |
|---|---|---|---|
| 平均応答時間 | 7-9ms | 200-450ms | 6.19ms |
| エラー率 | 0% | 0% | 0% |
| Apdex Score | 100% | 変動あり | 100% |
| CPU使用率 | 効率的 | 低使用率 | 効率的 |
🚀 次のステップ
この検証を踏まえて、以下の発展的な取り組みを計画:
- 非同期処理での遅延実装:
CompletableFutureを使用した遅延 - データベース遅延の検証: JPA Repositoryでの意図的な遅延
- 分散トレーシング: マイクロサービス間での性能監視
- カスタムメトリクス: ビジネス固有の指標監視
📚 学習リソース
この検証により、New Relic APMの監視能力とSpring Bootアプリケーションでの性能分析手法について実践的な知見を得ることができました。
実際の性能問題調査や監視システムの効果検証において、今回の手法は非常に有効です。特に、意図的な遅延機能の実装は、監視ツールの動作確認や新入社員への性能監視教育にも活用できる汎用的なアプローチだと考えています。