


この記事は公開されてから1年以上経過しています。情報が古い可能性がありますので十分ご注意ください。
プロジェクトにおいて、ログは重要ですよね。しかし、収集すべきログは無数にあり、ログの場所もさまざまです。ログ監視はCloudWatchエージェントを利用して、CloudWatchログに一本化するのはどうでしょうか。
今回わたしはCloudWatchエージェントを利用して、Windowsサーバーから任意のログをCloudWatchログに収集してみます。
WindowsサーバーのログをCloudWatchエージェントで収集
取得するログ確認
わたしは冒頭でログは無数にあると書きました。すべてを収集すると重要なログを見落とすかもしれません。はじめに取得するログを決めておきましょう。WindowsにインストールするCloudWatchエージェントはイベントログとカスタマイログを収集することができます。
- イベントログ例
●System
●Application
●Security
- カスタマイズログ例
カスタマイズログはイベントログと違い、収集したいログが置いてある場所(パス)を指定する必要があります。
●WSUS動作ログ
path: C:\Program Files\Update Services\LogFiles\Change.log
path: C:\Program Files\Update Services\LogFiles\SoftwareDistribution.log
●IISアプリケーションとしての動作ログ
path: C:\Windows\System32\LogFiles\HTTPERR
●Windows Internal Database(WID) 動作ログ
path: C:\Windows\WID\Log\error.log
■1.IAMロール作成
ログ収集したいEC2インスタンスにアタッチするためのIAMロールを作成します。アタッチするポリシーは以下の3つです。
- CloudWatchAgentAdminPolicy
- CloudWatchAgentServerPolicy
- AmazonSSMManagedInstanceCore
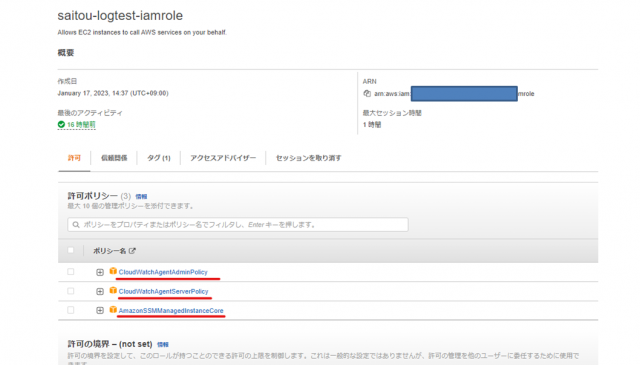

"CloudWatchAgentAdminPolicy"と"CloudWatchAgentServerPolicy"は、CloudWatchエージェントがメトリクスやログをCloudWatchに書き込むために必要なアクセスを許可するためや、パラメータストアへのファイルの書き込み、パラメータストアからのファイルのダウンロードを許可するためのポリシーです。
"AmazonSSMManagedInstanceCore"はインスタンスにプリインストールされているSSMエージェントを利用し、AWS SystemManagerによるリソースを更新、管理、設定ができるようになるポリシーです。AWS SystemManagerのRun commandを利用すれば、インスタンスが複数台ある場合に一括でアプリケーションをインストール・実行ができるようになります。
■2.CloudWatchエージェントインストール
まずはインスタンスのログを収集するために欠かせないCloudWatchエージェントをインストールします。Windowsサーバーの場合、RDPで接続してからコマンドプロンプトなどでインストールしてもいいのですが、今回はAWS SystemManagerを利用し複数台に一括でインストールしてみます。
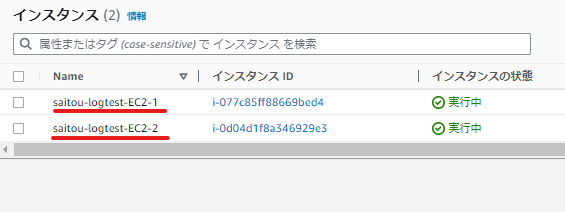
今回はOSがWindowsのEC2インスタンスを2台用意しました。

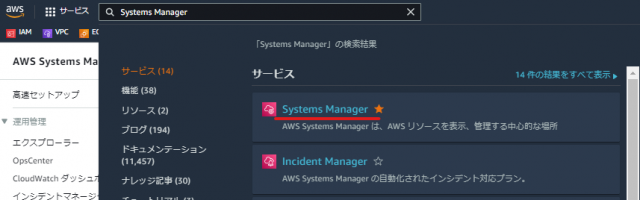
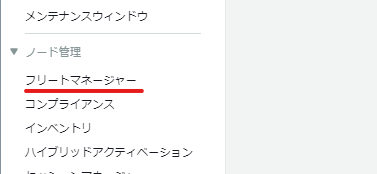
インストール作業をしましょう。SystemsManagerのダッシュボード画面に行きます。

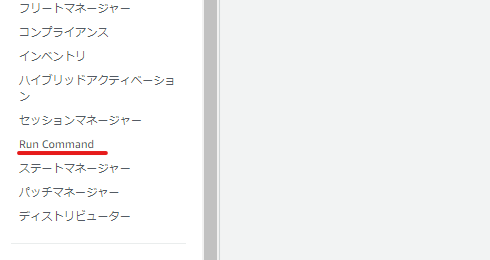
↓左ペインから[フリートマネージャー]をクリックしてください。

↓準備したインスタンスがマネージドノードとして認識されているか確認します。
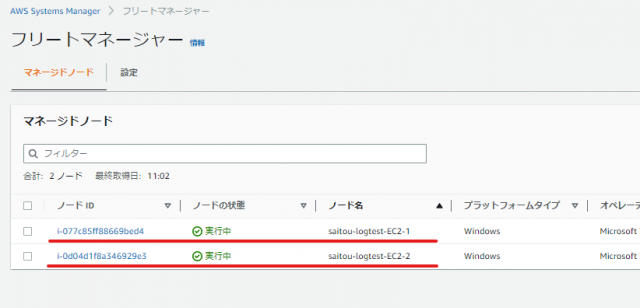

↓無事認識されていますね。認識されていないと、Run commandを利用しての一括インストールができません。※既存のインスタンスにIAMロール・ポリシーをアタッチした場合、マネージドノードになるまでに30分ほどかかる場合があります。
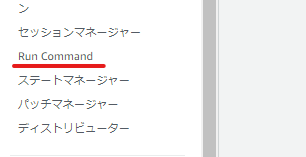
↓次に左ペインから[Run command]をクリックしてください。

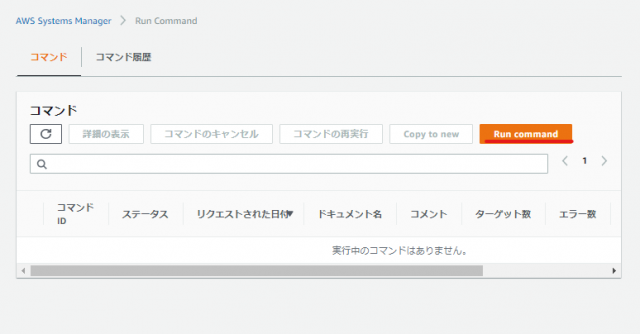
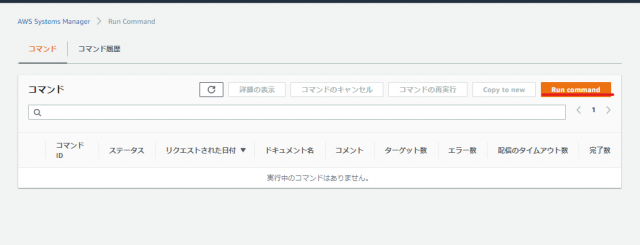
↓オレンジ色のボタンの[Run command]を押しましょう。

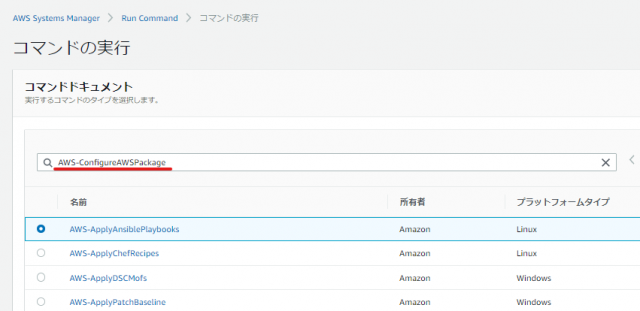
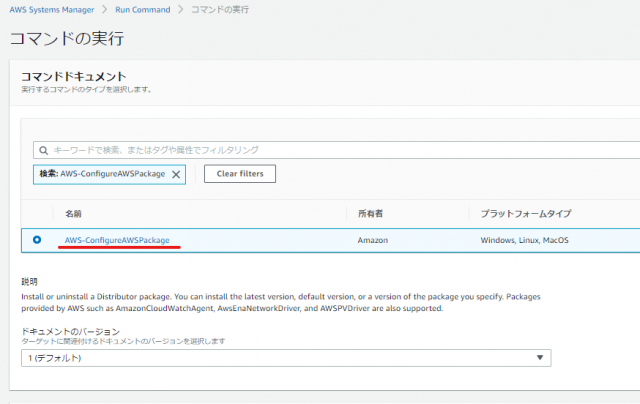
↓[コマンドドキュメント]の項目で"AWS-ConfigureAWSPackage"を検索し、ラジオボタンをクリックしてください。
AWS-ConfigureAWSPackage

↓

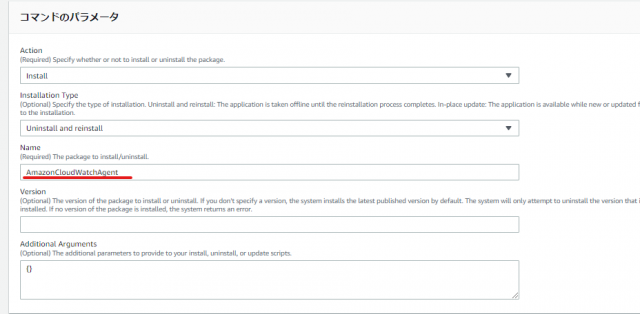
↓[コマンドのパラメータ]の[Name]欄で、[AmazonCloudWatchAgent]と入力します。[Version]欄は空白でも可です。空白にしていればデフォルトで最新のバージョンがインストールされます。
AmazonCloudWatchAgent

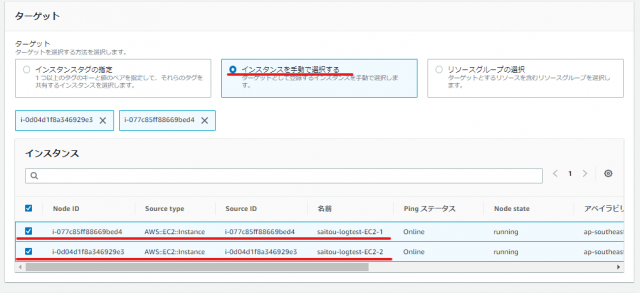
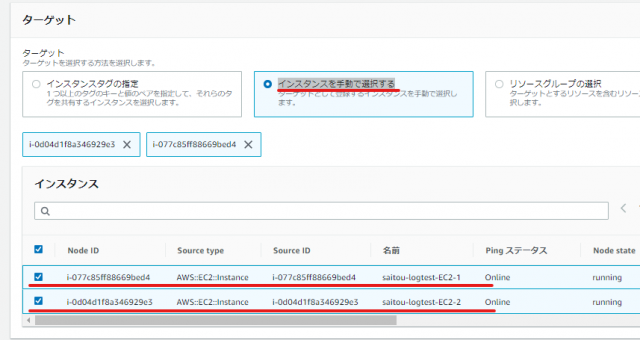
↓[ターゲット]の項目で、[インスタンスを手動で選択する]のラジオボタンをクリックし、該当のインスタンスのチェックボックスをクリックします。複数選択することで、一括でエージェントをインストールすることができます。

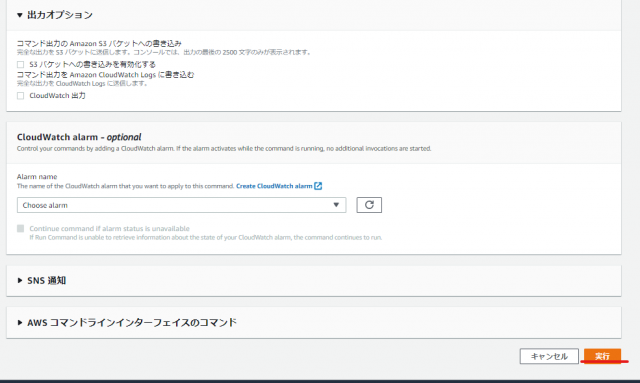
↓今回はテストですので、出力を無効にしておきます。ほかに要件がなければ、[実行]をクリックしてください。

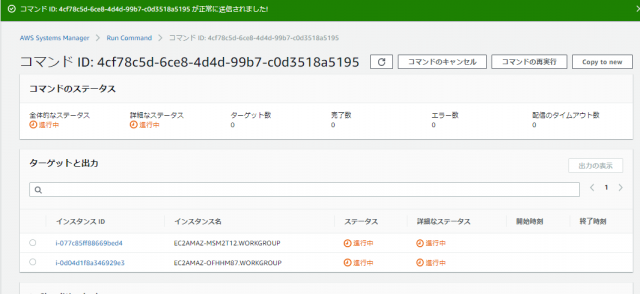
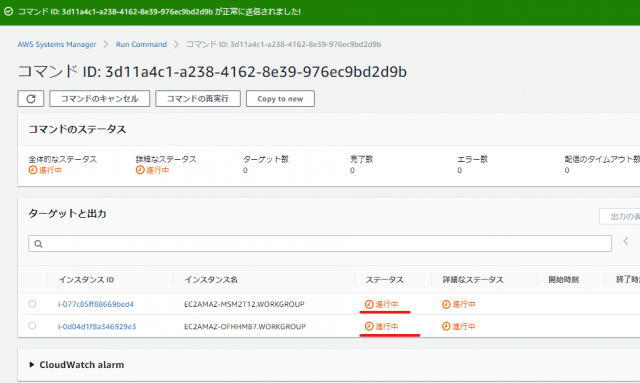
↓“コマンド ID: 4cf78c5d-6ce8-4d4d-99b7-c0d3518a5195 が正常に送信されました”と表示され、ステータスが“進行中”と表示されています。

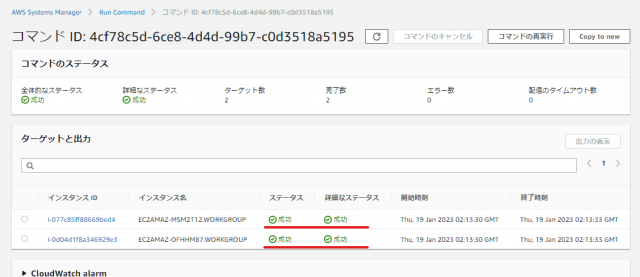
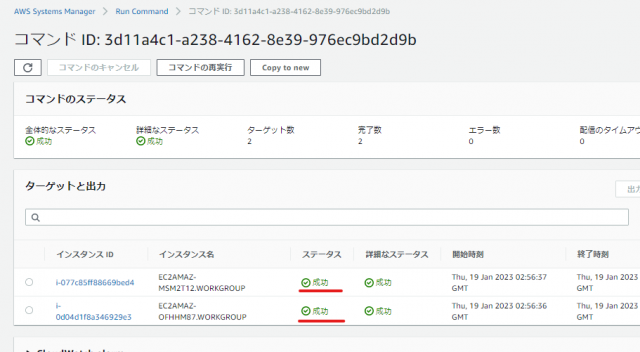
↓10秒ほどでステータスが“成功”に変わりました。

対象インスタンスへのCloudWatchエージェントのインストールが完了です。
■3.エージェント設定ファイル作成
CloudWatchエージェントをインストールしましたら、次は設定ファイルの作成です。設定ファイルを作成することで、任意のログファイルを収集することができます。
まずは該当のインスタンスにRDPで接続してください。わたしが用意したEC2インスタンスはパブリックサブネットに配置していますので、複雑な設定をしなくてもRDP接続できます。プライベートサブネットに配置している場合は、こちらを参考にしてください。
Windowsサーバーのデスクトップ画面が表示されましたら、コマンドプロンプトを実行してください。
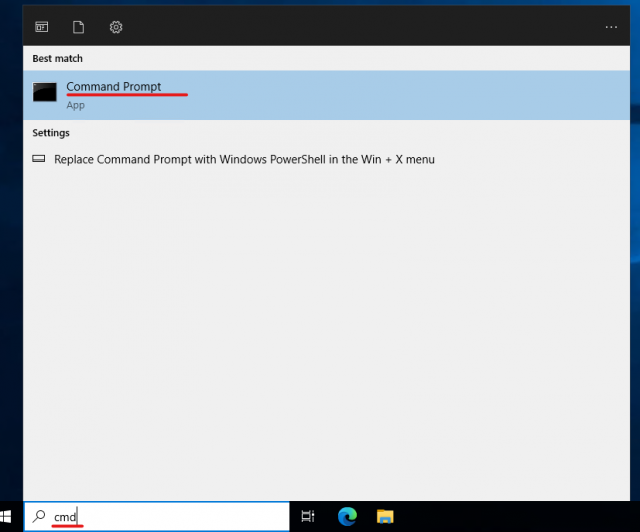

コマンドプロンプトが起動しましたら、以下のコマンドを打ちましょう。
cd "C:\Program Files\Amazon\AmazonCloudWatchAgent"
amazon-cloudwatch-agent-config-wizard.exe
エージェント構成ファイル ウィザードが起動しましたら、質問に答えていきましょう。前半部分はCloudWatchメトリクスにかかわる部分なので、要件がなければデフォルトで進みましょう。
C:\Program Files\Amazon\AmazonCloudWatchAgent>amazon-cloudwatch-agent-config-wizard.exe
================================================================
= Welcome to the Amazon CloudWatch Agent Configuration Manager =
=                                                              =
= CloudWatch Agent allows you to collect metrics and logs from =
= your host and send them to CloudWatch. Additional CloudWatch =
= charges may apply.                                           =
================================================================
On which OS are you planning to use the agent?
1. linux
2. windows
3. darwin
default choice: [2]:

Trying to fetch the default region based on ec2 metadata...
Are you using EC2 or On-Premises hosts?
1. EC2
2. On-Premises
default choice: [1]:

Do you want to turn on StatsD daemon?
1. yes
2. no
default choice: [1]:

Which port do you want StatsD daemon to listen to?
default choice: [8125]

What is the collect interval for StatsD daemon?
1. 10s
2. 30s
3. 60s
default choice: [1]:

What is the aggregation interval for metrics collected by StatsD daemon?
1. Do not aggregate
2. 10s
3. 30s
4. 60s
default choice: [4]:

Do you have any existing CloudWatch Log Agent configuration file to import for migration?
1. yes
2. no
default choice: [2]:

Do you want to monitor any host metrics? e.g. CPU, memory, etc.
1. yes
2. no
default choice: [1]:

Do you want to monitor cpu metrics per core?
1. yes
2. no
default choice: [1]:

Do you want to add ec2 dimensions (ImageId, InstanceId, InstanceType, AutoScalingGroupName) into all of your metrics if the info is available?
1. yes
2. no
default choice: [1]:

Do you want to aggregate ec2 dimensions (InstanceId)?
1. yes
2. no
default choice: [1]:

Would you like to collect your metrics at high resolution (sub-minute resolution)? This enables sub-minute resolution for all metrics, but you can customize for specific metrics in the output json file.
1. 1s
2. 10s
3. 30s
4. 60s
default choice: [4]:

Which default metrics config do you want?
1. Basic
2. Standard
3. Advanced
4. None
default choice: [1]:

Current config as follows:
{
        "metrics": {
                "aggregation_dimensions": [
                        [
                                "InstanceId"
                        ]
                ],
                "append_dimensions": {
                        "AutoScalingGroupName": "${aws:AutoScalingGroupName}",
                        "ImageId": "${aws:ImageId}",
                        "InstanceId": "${aws:InstanceId}",
                        "InstanceType": "${aws:InstanceType}"
                },
                "metrics_collected": {
                        "LogicalDisk": {
                                "measurement": [
                                        "% Free Space"
                                ],
                                "metrics_collection_interval": 60,
                                "resources": [
                                        "*"
                                ]
                        },
                        "Memory": {
                                "measurement": [
                                        "% Committed Bytes In Use"
                                ],
                                "metrics_collection_interval": 60
                        },
                        "statsd": {
                                "metrics_aggregation_interval": 60,
                                "metrics_collection_interval": 10,
                                "service_address": ":8125"
                        }
                }
        }
}
Are you satisfied with the above config? Note: it can be manually customized after the wizard completes to add additional items.
1. yes
2. no
default choice: [1]:
ここからログに関する質問がされます。今回収集するログは、以下のログです。
- System(イベントログ)
- Application(イベントログ)
- Security(イベントログ)
- WSUS動作ログ2種類(カスタマイズログ)
- IISエラーログ(カスタマイズログ)
- WID動作ログ(カスタマイズログ)
イベントログはログの名前だけで設定可能ですのですが、他のログは保管されているログの場所を指定してあげます。
それでは設定ファイル作成の続きをやっていきます。
Do you want to monitor any customized log files?
1. yes
2. no
default choice: [1]:

Log file path:
C:\Program Files\Update Services\LogFiles\Change.log
Log group name:
default choice: [Change.log]

Log stream name:
default choice: [{instance_id}]

Log Group Retention in days
1. -1
2. 1
3. 3
4. 5
5. 7
6. 14
7. 30
8. 60
9. 90
10. 120
11. 150
12. 180
13. 365
14. 400
15. 545
16. 731
17. 1827
18. 2192
19. 2557
20. 2922
21. 3288
22. 3653
default choice: [1]:

Do you want to specify any additional log files to monitor?
1. yes
2. no
default choice: [1]:

Log file path:
C:\Program Files\Update Services\LogFiles\SoftwareDistribution.log
Log group name:
default choice: [SoftwareDistribution.log]

Log stream name:
default choice: [{instance_id}]

Log Group Retention in days
1. -1
2. 1
3. 3
4. 5
5. 7
6. 14
7. 30
8. 60
9. 90
10. 120
11. 150
12. 180
13. 365
14. 400
15. 545
16. 731
17. 1827
18. 2192
19. 2557
20. 2922
21. 3288
22. 3653
default choice: [1]:

Do you want to specify any additional log files to monitor?
1. yes
2. no
default choice: [1]:

Log file path:
C:\Windows\System32\LogFiles\HTTPERR\httperr.log
Log group name:
default choice: [httperr.log]

Log stream name:
default choice: [{instance_id}]

Log Group Retention in days
1. -1
2. 1
3. 3
4. 5
5. 7
6. 14
7. 30
8. 60
9. 90
10. 120
11. 150
12. 180
13. 365
14. 400
15. 545
16. 731
17. 1827
18. 2192
19. 2557
20. 2922
21. 3288
22. 3653
default choice: [1]:

Do you want to specify any additional log files to monitor?
1. yes
2. no
default choice: [1]:

Log file path:
C:\Windows\WID\Log\error.log
Log group name:
default choice: [error.log]

Log stream name:
default choice: [{instance_id}]

Log Group Retention in days
1. -1
2. 1
3. 3
4. 5
5. 7
6. 14
7. 30
8. 60
9. 90
10. 120
11. 150
12. 180
13. 365
14. 400
15. 545
16. 731
17. 1827
18. 2192
19. 2557
20. 2922
21. 3288
22. 3653
default choice: [1]:

Do you want to specify any additional log files to monitor?
1. yes
2. no
default choice: [1]:
2
Do you want to monitor any Windows event log?
1. yes
2. no
default choice: [1]:

Windows event log name:
default choice: [System]

Do you want to monitor VERBOSE level events for Windows event log System ?
1. yes
2. no
default choice: [1]:

Do you want to monitor INFORMATION level events for Windows event log System ?
1. yes
2. no
default choice: [1]:

Do you want to monitor WARNING level events for Windows event log System ?
1. yes
2. no
default choice: [1]:

Do you want to monitor ERROR level events for Windows event log System ?
1. yes
2. no
default choice: [1]:

Do you want to monitor CRITICAL level events for Windows event log System ?
1. yes
2. no
default choice: [1]:

Log group name:
default choice: [System]

Log stream name:
default choice: [{instance_id}]

In which format do you want to store windows event to CloudWatch Logs?
1. XML: XML format in Windows Event Viewer
2. Plain Text: Legacy CloudWatch Windows Agent (SSM Plugin) Format
default choice: [1]:

Log Group Retention in days
1. -1
2. 1
3. 3
4. 5
5. 7
6. 14
7. 30
8. 60
9. 90
10. 120
11. 150
12. 180
13. 365
14. 400
15. 545
16. 731
17. 1827
18. 2192
19. 2557
20. 2922
21. 3288
22. 3653
default choice: [1]:

Do you want to specify any additional Windows event log to monitor?
1. yes
2. no
default choice: [1]:

Windows event log name:
default choice: [System]
Application
Do you want to monitor VERBOSE level events for Windows event log Application ?
1. yes
2. no
default choice: [1]:

Do you want to monitor INFORMATION level events for Windows event log Application ?
1. yes
2. no
default choice: [1]:

Do you want to monitor WARNING level events for Windows event log Application ?
1. yes
2. no
default choice: [1]:

Do you want to monitor ERROR level events for Windows event log Application ?
1. yes
2. no
default choice: [1]:

Do you want to monitor CRITICAL level events for Windows event log Application ?
1. yes
2. no
default choice: [1]:

Log group name:
default choice: [Application]

Log stream name:
default choice: [{instance_id}]

In which format do you want to store windows event to CloudWatch Logs?
1. XML: XML format in Windows Event Viewer
2. Plain Text: Legacy CloudWatch Windows Agent (SSM Plugin) Format
default choice: [1]:

Log Group Retention in days
1. -1
2. 1
3. 3
4. 5
5. 7
6. 14
7. 30
8. 60
9. 90
10. 120
11. 150
12. 180
13. 365
14. 400
15. 545
16. 731
17. 1827
18. 2192
19. 2557
20. 2922
21. 3288
22. 3653
default choice: [1]:

Do you want to specify any additional Windows event log to monitor?
1. yes
2. no
default choice: [1]:

Windows event log name:
default choice: [System]
Security
Do you want to monitor VERBOSE level events for Windows event log Security ?
1. yes
2. no
default choice: [1]:

Do you want to monitor INFORMATION level events for Windows event log Security ?
1. yes
2. no
default choice: [1]:

Do you want to monitor WARNING level events for Windows event log Security ?
1. yes
2. no
default choice: [1]:

Do you want to monitor ERROR level events for Windows event log Security ?
1. yes
2. no
default choice: [1]:

Do you want to monitor CRITICAL level events for Windows event log Security ?
1. yes
2. no
default choice: [1]:

Log group name:
default choice: [Security]

Log stream name:
default choice: [{instance_id}]

In which format do you want to store windows event to CloudWatch Logs?
1. XML: XML format in Windows Event Viewer
2. Plain Text: Legacy CloudWatch Windows Agent (SSM Plugin) Format
default choice: [1]:

Log Group Retention in days
1. -1
2. 1
3. 3
4. 5
5. 7
6. 14
7. 30
8. 60
9. 90
10. 120
11. 150
12. 180
13. 365
14. 400
15. 545
16. 731
17. 1827
18. 2192
19. 2557
20. 2922
21. 3288
22. 3653
default choice: [1]:

Do you want to specify any additional Windows event log to monitor?
1. yes
2. no
default choice: [1]:
2
Saved config file to config.json successfully.
Current config as follows:
{
        "logs": {
                "logs_collected": {
                        "files": {
                                "collect_list": [
                                        {
                                                "file_path": "C:\\Program Files\\Update Services\\LogFiles\\Change.log",
                                                "log_group_name": "Change.log",
                                                "log_stream_name": "{instance_id}",
                                                "retention_in_days": -1
                                        },
                                        {
                                                "file_path": "C:\\Program Files\\Update Services\\LogFiles\\SoftwareDistribution.log",
                                                "log_group_name": "SoftwareDistribution.log",
                                                "log_stream_name": "{instance_id}",
                                                "retention_in_days": -1
                                        },
                                        {
                                                "file_path": "C:\\Windows\\System32\\LogFiles\\HTTPERR\\httperr.log",
                                                "log_group_name": "httperr.log",
                                                "log_stream_name": "{instance_id}",
                                                "retention_in_days": -1
                                        },
                                        {
                                                "file_path": "C:\\Windows\\WID\\Log\\error.log",
                                                "log_group_name": "error.log",
                                                "log_stream_name": "{instance_id}",
                                                "retention_in_days": -1
                                        }
                                ]
                        },
                        "windows_events": {
                                "collect_list": [
                                        {
                                                "event_format": "xml",
                                                "event_levels": [
                                                        "VERBOSE",
                                                        "INFORMATION",
                                                        "WARNING",
                                                        "ERROR",
                                                        "CRITICAL"
                                                ],
                                                "event_name": "System",
                                                "log_group_name": "System",
                                                "log_stream_name": "{instance_id}",
                                                "retention_in_days": -1
                                        },
                                        {
                                                "event_format": "xml",
                                                "event_levels": [
                                                        "VERBOSE",
                                                        "INFORMATION",
                                                        "WARNING",
                                                        "ERROR",
                                                        "CRITICAL"
                                                ],
                                                "event_name": "Application",
                                                "log_group_name": "Application",
                                                "log_stream_name": "{instance_id}",
                                                "retention_in_days": -1
                                        },
                                        {
                                                "event_format": "xml",
                                                "event_levels": [
                                                        "VERBOSE",
                                                        "INFORMATION",
                                                        "WARNING",
                                                        "ERROR",
                                                        "CRITICAL"
                                                ],
                                                "event_name": "Security",
                                                "log_group_name": "Security",
                                                "log_stream_name": "{instance_id}",
                                                "retention_in_days": -1
                                        }
                                ]
                        }
                }
        },
        "metrics": {
                "aggregation_dimensions": [
                        [
                                "InstanceId"
                        ]
                ],
                "append_dimensions": {
                        "AutoScalingGroupName": "${aws:AutoScalingGroupName}",
                        "ImageId": "${aws:ImageId}",
                        "InstanceId": "${aws:InstanceId}",
                        "InstanceType": "${aws:InstanceType}"
                },
                "metrics_collected": {
                        "LogicalDisk": {
                                "measurement": [
                                        "% Free Space"
                                ],
                                "metrics_collection_interval": 60,
                                "resources": [
                                        "*"
                                ]
                        },
                        "Memory": {
                                "measurement": [
                                        "% Committed Bytes In Use"
                                ],
                                "metrics_collection_interval": 60
                        },
                        "statsd": {
                                "metrics_aggregation_interval": 60,
                                "metrics_collection_interval": 10,
                                "service_address": ":8125"
                        }
                }
        }
}
Please check the above content of the config.
The config file is also located at config.json.
Edit it manually if needed.
Do you want to store the config in the SSM parameter store?
1. yes
2. no
default choice: [1]:

What parameter store name do you want to use to store your config? (Use 'AmazonCloudWatch-' prefix if you use our managed AWS policy)
default choice: [AmazonCloudWatch-windows]
AmazonCloudWatch-windows-saitou-logtest
Trying to fetch the default region based on ec2 metadata...
Which region do you want to store the config in the parameter store?
default choice: [ap-southeast-1]

Which AWS credential should be used to send json config to parameter store?
1. ASIA2N5I5XLCLDCO23NX(From SDK)
2. Other
default choice: [1]:

Successfully put config to parameter store AmazonCloudWatch-windows-saitou-logtest.
Please press Enter to exit...

Program exits now.

C:\Program Files\Amazon\AmazonCloudWatchAgent>
質問部分で、パラメータストアに保存する際のファイル名を入力する箇所があります。名前は変更可能ですが、[AmazonCloudWatch-windows-]から始まる必要があります。
What parameter store name do you want to use to store your config? (Use 'AmazonCloudWatch-' prefix if you use our managed AWS policy)
default choice: [AmazonCloudWatch-windows]
設定ファイルの作成は以上です。各質問について詳しい内容が知りたいという方は、弊社メンバーnakaniwaのこちらのブログを参照してください。
■4.CloudWatchエージェント起動
エージェント設定ファイルを作成しましたら、エージェントを起動します。今回用意したWindowsサーバー2台に対し、一括で起動を実施してみましょう。CloudWatchエージェントが参照する設定ファイルが違う場合はできませんが、今回は2台とも同じ設定ファイルを指定します。
AWS SystemManagerコンソール画面の左ペインから[Run command]をクリックし、右側のオレンジ色の[Run command]をクリックしてください。

↓

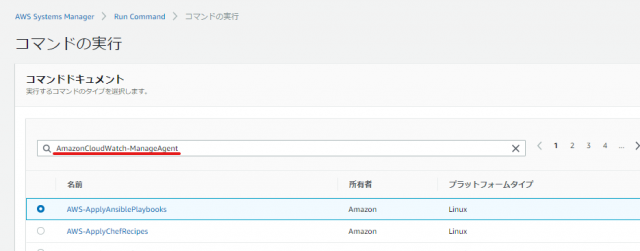
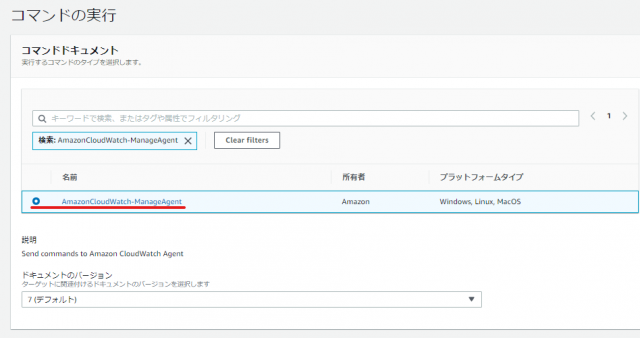
↓[コマンドドキュメント]の項目で[AmazonCloudWatch-ManageAgent]を検索し、ラジオボタンをクリックします。
AmazonCloudWatch-ManageAgent

↓

↓[コマンドのパラメータ]項目の[Optional Configuration Location]欄で、AmazonCloudWatch-windows-saitou-logtestを入力してください。
↓[ターゲット]項目で[インスタンスを手動で選択する]をクリックし、対象インスタンスを選択してください。

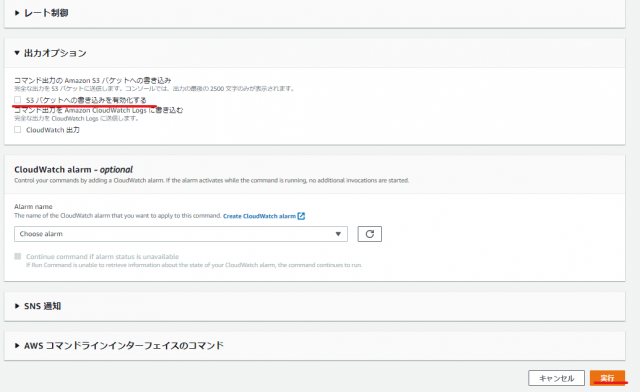
↓出力オプションは[S3 バケットへの書き込みを有効化する]のチェックを外します。ほかの設定は任意で設定し、[実行]をクリックしてください。

↓ステータスが"進行中"と表示されます。
↓10秒ほどで”成功”と出ました。

エージェントの起動は以上です。
■5.ログ確認
ログが収集されているかAWSのマネージメントコンソールから確認してみましょう。
CloudWatchのダッシュボード画面の左ペインから[ロググループ]をクリックしてください。エージェントを起動したら、すぐにロググループが作成され、収集されているはずです。
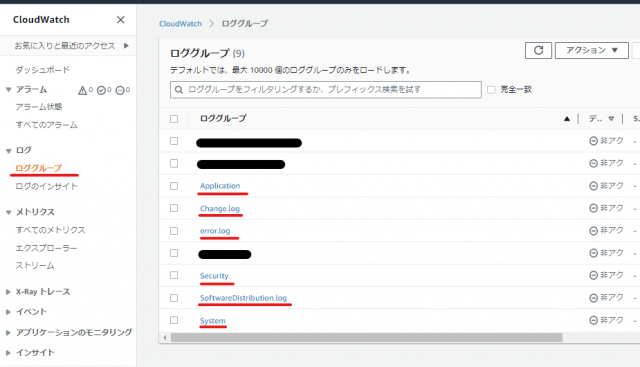

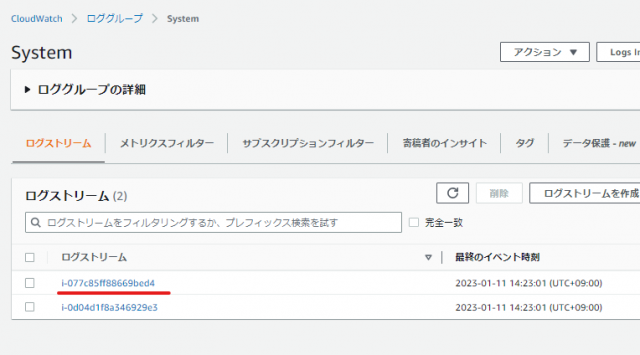
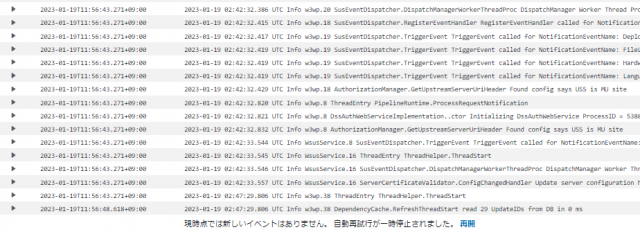
↓試しにイベントログの"System"を見てみます。ログストリーム名はインスタンスIDで表示されています。任意でHostNameなどに変えることも可能です。

↓ログを見てみると収集されていますね。
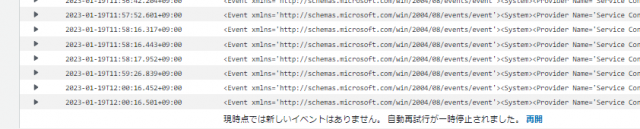

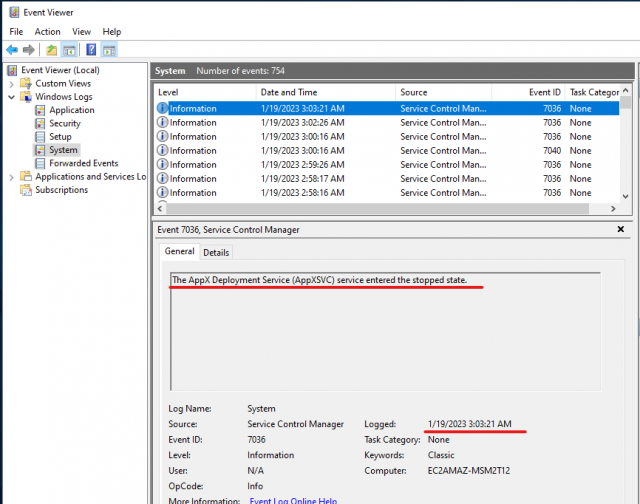
↓念のため、対象インスタンスのイベントビューアーでSystemログと比較してみましょう。
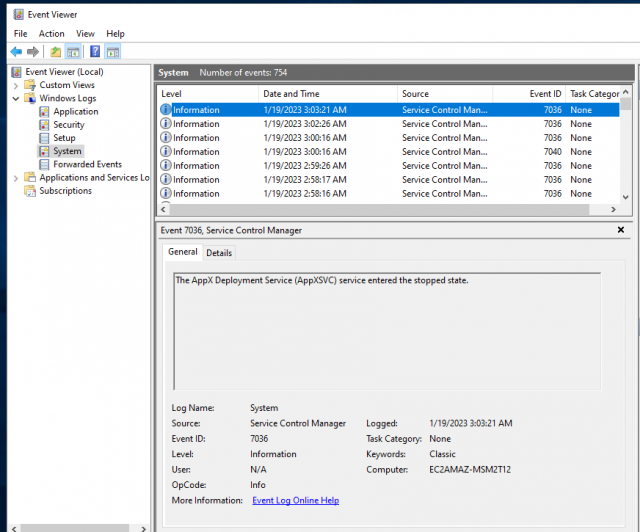
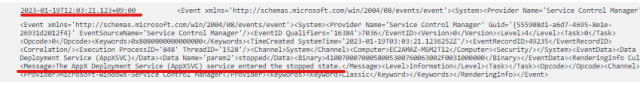
↓CloudWatchログに収集された最新のSystemログのメッセージは、"The Appx ~"というものです。

↓イベントビューアーを見てみると、同じメッセージが出ていますね。

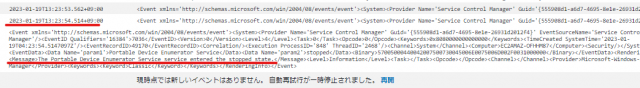
もう一台のインスタンスのログも確認してみます。こちらもSystemログを見てみましょう。まずはCloudWatchログにログが収集されていることが確認できます。

↓イベントビューアーを見ると、"The Portable Device ~"というメッセージが出ています。
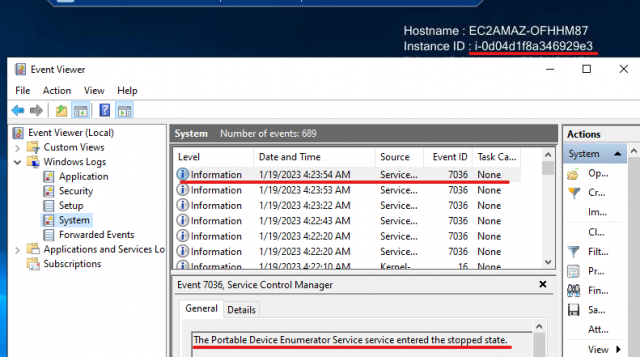

↓CloudWatchログで確認してみると、同じログが確認できました。

■まとめ:EC2インスタンスのログをCloudWatchログで収集(windows編)
プロジェクトを円滑に進め、適切な運用をするためにはログが必要不可欠です。ログが一カ所で集中監視できれば、効率も上がるかと思います。
CloudWatchエージェントのインストールは面倒そうだと思っている方もいるかと思いますが、SystemManagerと併用すれば簡単に実行可能です。SystemManagerも合わせて使ってみてください。
参考リンク:AWS公式ドキュメント
↓ほかの協栄情報メンバーもAmazon CloudWatchに関する記事を公開しています。ぜひ参考にしてみてください。
■CloudWatchでサーバーを監視し、メトリクスの閾値を超えた時にメールで通知を受けとる。(nakaniwa)
https://cloud5.jp/cloudwatch-agent-nakaniwa/
■特定IAMユーザに特定のタグが付与されたCloudWatch Logsのみ参照を許可する IAM ポリシー(小林 剛)
https://cloud5.jp/log-access-control-with-tag/
■RDSイベントを取得してCloudWatchLogsに出力するハンズオン(INAMURA)
https://cloud5.jp/rds-events-send-to-cloudwatchlogs/
■CloudWatch Logs の利用量が急増の場合、問題ロググループを特定する方法(dapeng)
https://cloud5.jp/cloudwatch-logs-incomingbytes/